Past the Point of No Return

Electricity costs are climbing nationwide. Learn what’s driving the surge, how policy and demand are shaping the market, and what informed leaders can do to prepare for what comes next.
Brief History Lesson
For most private investors, the universe of trustworthy, high-performing opportunities often feels narrow. The stock marketLet’s take a quick trip down memory lane. July 14, 2022 Washington Post headline: “Manchin Says He Won’t Support New Climate Spending … marking a massive setback for party lawmakers who had hoped to advance a central element of their agenda before the midterm elections.”
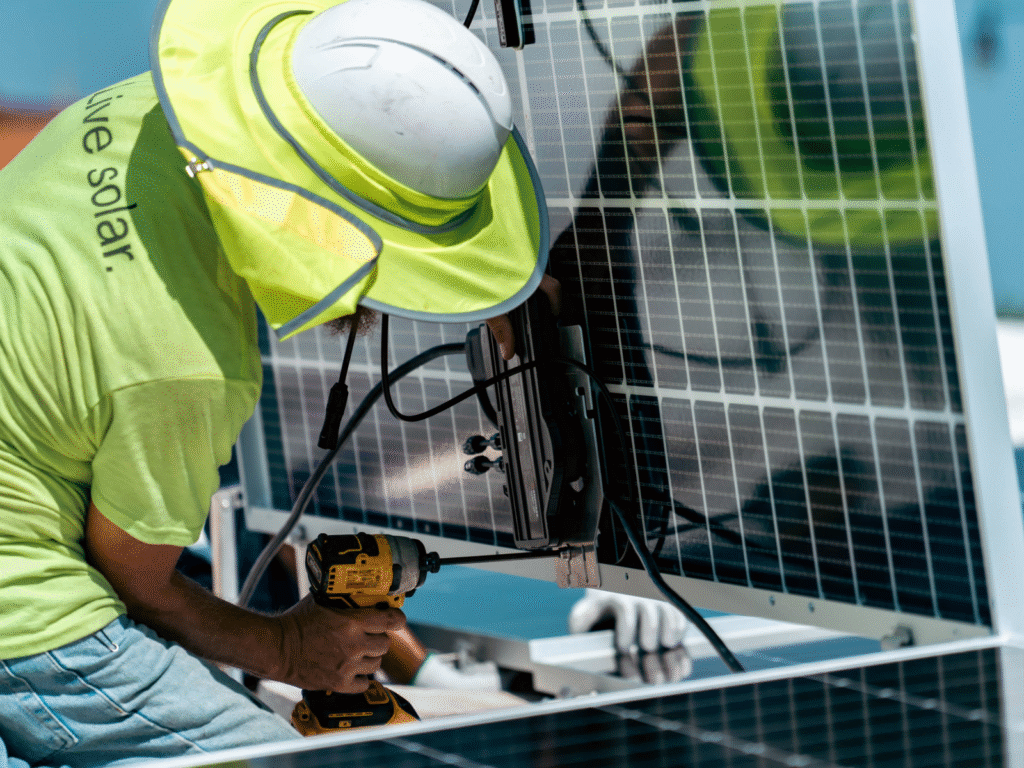
As the CFO of a solar installer, I remember that day well. At that time, the solar investment tax credit (“ITC”) was at 26%, set to drop to 22% in 2023 and then be completely eliminated in 2024 for residential solar (or down to 10% for commercial solar). The future of the industry was very much in the balance and in the hands of our political leaders.
What if on the afternoon of July 14, 2022, the solar energy industry was given the ability to select one of two options below?
Option 1
- Increase the ITC to 30%
- Provide new bonus tax adders increasing the commercial ITC up to 70%
- Allow the ITC to be carried back 3 years instead of the at-that-time 1 year carryback
- Allow standalone storage to receive the ITC for the first time ever
- Allow tax exempt entities to receive ITC benefits via direct pay for the first time ever
- Allow transferability of the ITC for the first time ever
- Allow the full commercial ITC to be received through the end of 2027 (or 2030 for projects that begin construction by July 4, 2026)
- Allow the full residential ITC to be received through the end of 2025 and allow residential leasing to extend through the end of 2027 (or 2030 for projects that begin construction by July 4, 2026)
- Introduce solar manufacturing tax credits unleashing billions of dollars of investment into onshoring the solar supply chain
Option 2
- Take your chances on something else becoming law
Option 1 above simply represents the combination of the Inflation Reduction Act and the One Big Beautiful Bill Act. It is only through the dysfunction of Washington D.C. that it took two separate reconciliation bills to get to that point as these two bills in conjunction represent what through normal order would have passed on a bipartisan basis back in 2022.
Give any solar energy executive truth serum in July 2022 and every single one would have gladly taken the outcome we have today.
Off the Charts Growth
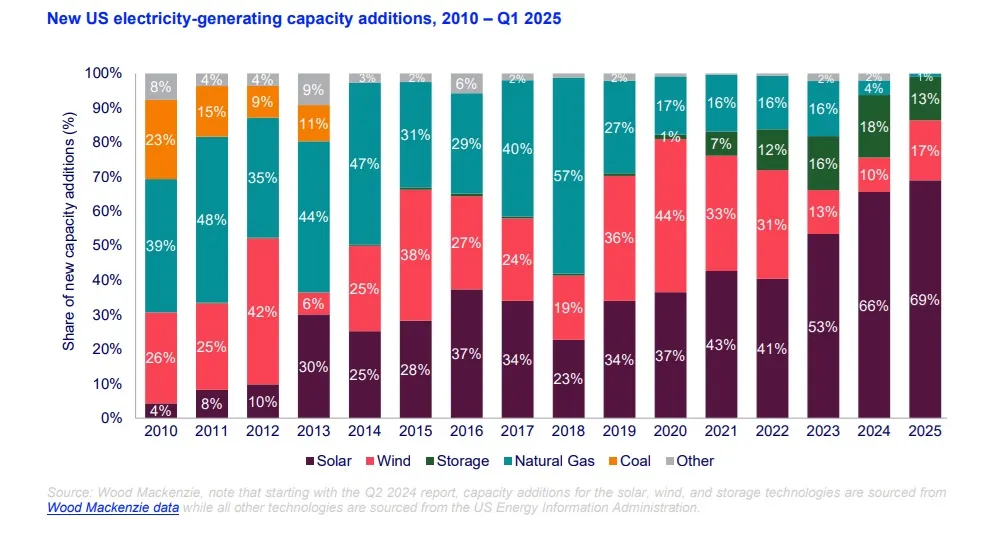
The story of new US electricity generating capacity additions is one that does not get enough attention. The recently-released Wood Mackenzie September 2025 US Solar Market Insight report shows an industry that has experienced hockey-stick-like growth. It is incredible to pause and recognize that a little over one decade ago, in 2010, solar and storage represented a mere 4% of new US electricity-generating capacity additions, whereas last year that grew to an eye-popping 85%.
The inverse of these numbers is equally striking with natural gas and coal dropping from 62% to 8% over that same period.
Just looking at solar alone over a shorter time horizon, it nearly doubled from 37% in 2020 to 67% in 2024. Storage went from basically nonexistent at 3% to 18%, a six-fold increase over that same period, and it continues its meteoric rise up to 26% in the first half of 2025. See below for a chart of this data from Wood Mackenzie:
The Results are In
As Politico recently reported, “States that embrace renewable energy are far more likely to save money for electricity consumers than those relying on fossil fuels or nuclear power… findings that undermine one of the Trump administration’s main justifications for its aggressive rollback of federal clean energy policies.”
Politico’s analysis, based on U.S. Energy Information Administration (EIA) power price data, found that in June of this year, 17 of the 22 states with above-average renewable energy production also had below-average electricity prices, a clear challenge to claims that clean energy drives up costs.
The graphic below is incredibly telling and really the whole ballgame. Ultimately, it will be the market and not short-term politics that decides the fate of any industry, and when it comes to sourcing electricity, the market will gravitate towards less expensive sources and away from higher cost alternatives.
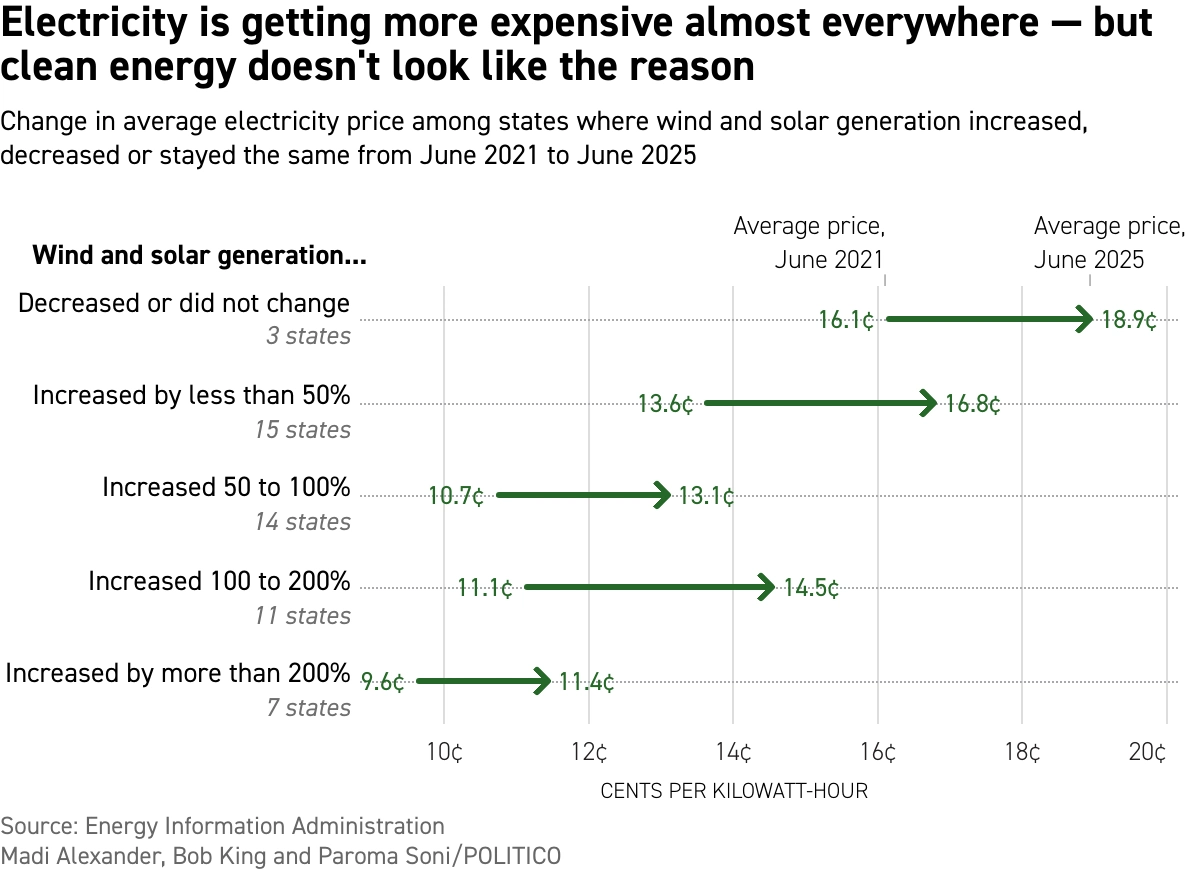
The data is clear: We are in the “Age of Renewable Energy” and it is past the point of no return.
Perspectives on modern operations and smart growth.


Let’s chat to see how we can unlock new opportunities for impact, together.